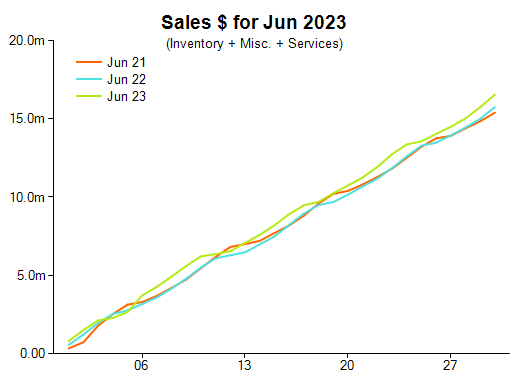
Data from June shows comparative overall sales dollar performance returned to positive territory, improving by five per cent compared with 2022 and eight per cent on the two-year difference.
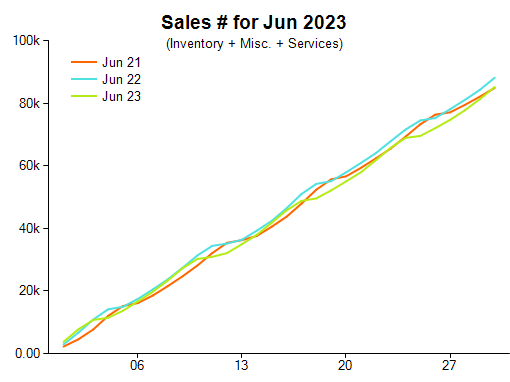
Comparative units sold decreased by 3.4 per cent on a year-by-year comparison.
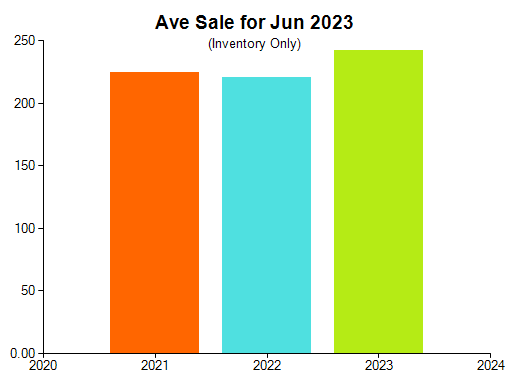
The comparative average sale in inventory only increased by 10 per cent on a year-by-year comparison ($242 from $220) and improved by eight per cent on a two-year comparison.
Looking at the performance across product categories, the diamond precious metal jewellery section improved by seven per cent compared with June 2022, Retail Edge sales manager Mike Dyer explained.
“Colour gemstone set precious metal jewellery shows sales dollars were down 18 per cent compared with June 2022 and declined 4.6 per cent on the two-year comparison to June 2021,” he said.
“Precious metal jewellery (without a diamond or gemstone) sales dollars were up 1.2 per cent, compared to June 2022 and improved 1.5 per cent on the two-year difference.”
Dyer added: “Silver and alternative metals jewellery sales dollars were down eight per cent compared with June 2022 and improved by 1.1 per cent on the two-year comparison to 2021.”
In more positive news, the pattern in laybys increased by 14 per cent in dollar terms between new orders and pickups or cancellations.
The pattern in services, such as repairs, was a 24 decline in dollar values between new incoming orders and pickups or cancellations.
“This is the fifth consecutive month of double-digit negative movement in this area. An entrenched consumer pattern that may need more than a small shift in consumer sentiment to flip the switch from off to on,” Dyer said.
“This is not to say you should sit back and accept what is happening but make some noise about your services, skills and expertise. Repairs are still being done, you just may need to make an effort to get, or keep, your share and maybe someone else’s.”
Special order numbers improved significantly (29 per cent) in dollar terms.
2023 Jewellery Retail Sales June Results
Charts published with permission courtesy of Retail Edge
The charts below are based on data collected via Retail Edge POS software
at more than 400 independent Australian jewellery stores.
More reading
Retail Edge urges caution in the latest market assessment
Weakened sales headlines April for jewellery retailers
Modest sales wins for Australian jewellery retailers
Optimism following February’s retail jewellery analysis
Surprise reversal pattern observed in Australian jewellery sales
Australian jewellery sales steady in December
Sales dip during November for Australian jewellers